Visualize GPU Memory Usage for Better Optimization
Track GPU memory usage to spot inefficiencies and optimize resource-heavy model deployments.
CVPR
Why This Works
Tracking memory usage helps identify inefficiencies, spikes, and fragmentation in GPU memory. By recording and visualizing these patterns, you can optimize model performance, debug memory leaks, and improve memory management, especially for large-scale or resource-limited applications.
Benefits
- Detects memory spikes and fragmentation.
- Optimizes model scaling and deployment.
- Enables debugging of memory leaks in complex pipelines.
Applications
Use this when developing memory-intensive models, deploying on limited-resource hardware, or scaling across multiple GPUs.
Usage
Use the code below to generate a profile.pkl file,
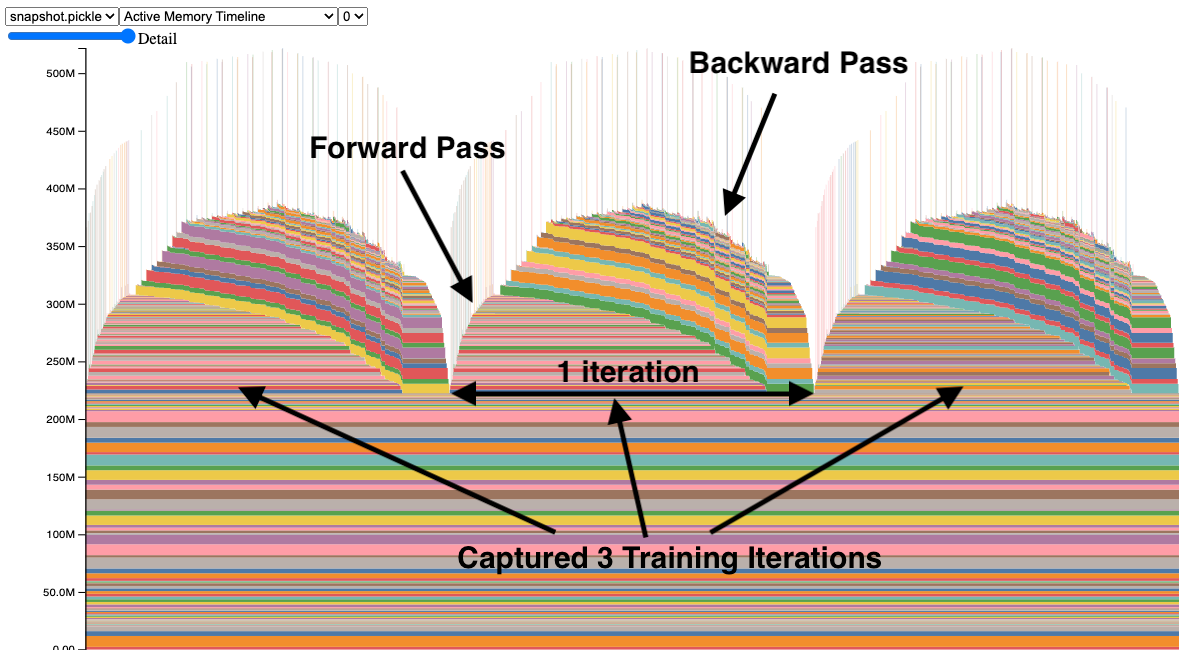
storing detailed memory usage data. Visualize it using PyTorch's memory visualizer.
import torch
from torch import nn

# Start recording memory snapshot history
torch.cuda.memory._record_memory_history(max_entries=100000)

# Example model and computation
model = nn.Linear(10_000, 50_000, device="cuda")
for _ in range(3):
    inputs = torch.randn(5_000, 10_000, device="cuda")
    outputs = model(inputs)

# Dump memory history to a file and stop recording
torch.cuda.memory._dump_snapshot("profile.pkl")
torch.cuda.memory._record_memory_history(enabled=None)
Visualization
Visualization tools : https://pytorch.org/memory_viz